PDF analysis with bauplan and OpenAI
Overview
This project demonstrates how to analyze financial documents (PDFs) using Bauplan for data preparation and OpenAI’s GPT for text analysis.
Use Case
We analyze quarterly financial reports of public companies to extract insights on their performance and generate structured reports.
Approach:
Data Preparation: A Bauplan pipeline processes raw financial PDFs into structured text.
Text Analysis: OpenAI APIs (ChatGPT) analyze the extracted content.
Report Generation: Bauplan formats the results into an Iceberg table stored in a data lake (S3).
Visualization: A Streamlit app provides an interactive UI to explore the reports.
The entire workflow runs in vanilla Python with open formats (Iceberg) and object storage (S3), making it adaptable for various NLP tasks like data augmentation, sentiment analysis, or financial comparisons.
Data Source
We use financial PDFs from tech companies, sourced from the SEC 10-Q dataset via Llama Index.
Pipeline
PDFs and metadata (year, quarter, company, S3 path) are stored in an Iceberg table.
The dataset is available in the public namespace upon joining Bauplan.
The pipeline in
src/bpln_pipelinecontains the data preparation and LLM analysis as simple, decorated Python functions - we use the markitdown package to go from PDF files to the simple text format we feed to the model. Running the pipeline in Bauplan will execute these functions and store the results in a new table.The Streamlit in
src/appshowcases how to visualize the final table in a simple web interface.
Both the pipeline and the app code are heavily commented to help you go through the code. Having said that, do not hesitate to reach out to the Bauplan team for any questions or clarifications.
Setup
Python environment
To run the project, you need to have Python >=3.10 installed. We recommend using a virtual environment to manage dependencies:
python3 -m venv venv
source venv/bin/activate
pip install -r requirements.txt
Bauplan
Join the Bauplan sandbox, sign in, create your username and API key.
Complete the 3-min tutorial to get familiar with the platform.
When you gain access, public datasets (including the one used in this project) will be available for you to start building pipelines.
OpenAI
Sign up on OpenAI to get your API key — you’re free to experiment with different LLMs by replacing the LLM utility code in the pipeline.
Once you have an OpenAI API key, you can add it as a secret to your Bauplan project. Open your terminal and run the following command replacing the value with your OpenAI token - This will allow Bauplan to connect OpenAI securely:
bauplan parameter set --name openai_api_key --value aaa --type secret
You can inspect the file bauplan_project.yml in the folder src/bpln_pipeline and you will see that a new parameter can be found:
parameters:
    openai_api_key:
        type: secret
        default: kUg6q4141413...
        key: awskms:///arn:aws:kms:us-...
Run the project
Check out the dataset
Using Bauplan, it is simple to get acquainted with the dataset and its schema:
bauplan table get public.sec_10_q_metadata
Note that pdf_path contains the address in S3 of the PDF files we will analyze. Let’s check them out with a simple query directly in your CLI:
bauplan query --no-trunc "SELECT bucket || '/' || pdf_path as s3_path FROM public.sec_10_q_metadata"
Running the pipeline with Bauplan
To run the pipeline - i.e. the DAG going from the metadata tables and files to the final report – you just need to create a data branch.
cd src/bpln_pipeline
bauplan branch create <YOUR_USERNAME>.sec_10
bauplan branch checkout <YOUR_USERNAME>.sec_10
You can now run the DAG:
bauplan run
You will notice that Bauplan streams back data in real-time, so every print statement will be visualized in your terminal. You can check that we successfully created the matching table with the following command:
bauplan table get sec_10_q_markdown
bauplan table get sec_10_q_analysis_openai
and even inspect the distribution of the predictions:
bauplan query "SELECT investment_sentiment, count(*) as _C FROM sec_10_q_analysis_openai GROUP BY 1"
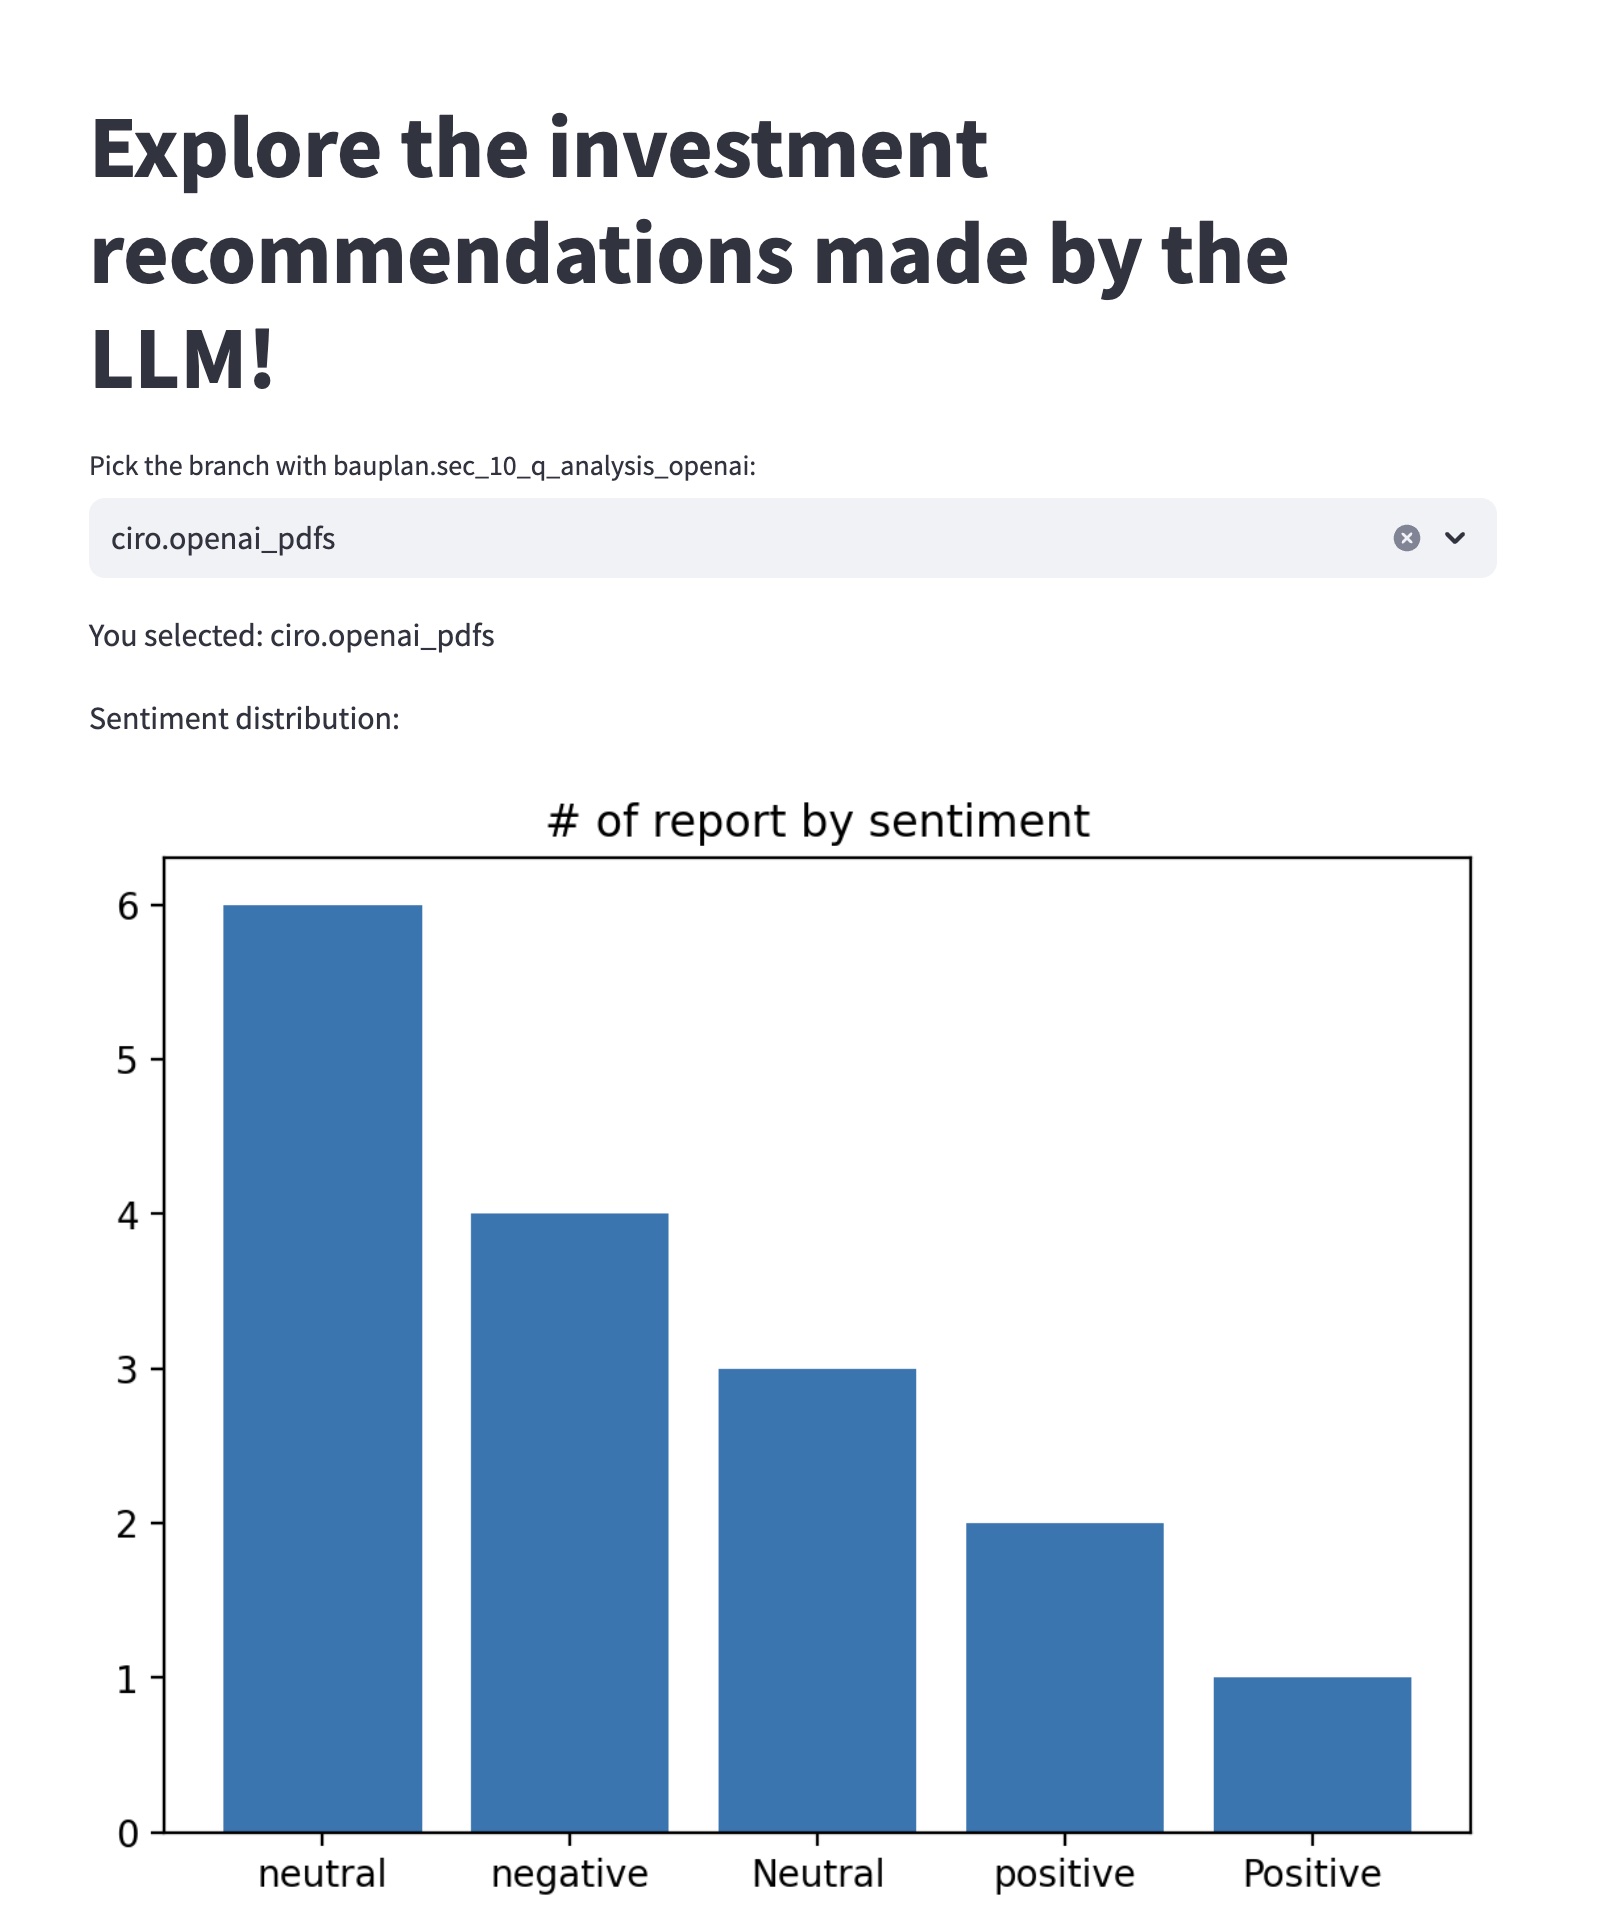
Exploring the report in Streamlit
We can visualize the predictions easily in any Python environment, using the bauplan SDK library to interact with the table we built with our pipeline. We provide a simple Streamlit app to do so.
To run the app:
cd src/app
streamlit run explore_analysis.py -- --bauplan_username <YOUR_USERNAME>
The app will open in your browser, and you can start exploring the results of the analysis carried out by the LLM.
Where do we go from here?
There are potentially several other tasks that can be automated. For example, instead of limiting ourselves to a scalar evaluation of the financial outlook of companies, let’s say that we want ChatGPT to:
Compare the growth of all the companies that we consider to have a positive outlook to NVIDIA Corporation’s performance in Q3 2023 (e.g. “Compare [COMPANY_NAME] and NVIDIA Q3 2023 revenue growth”)
Produce a third table that contains these comparisons for a qualitative evaluation.
License
The code in this repository is released under the MIT License and provided as is.