Near Real-time Analytics with Prefect and Streamlit
In this example, we demonstrate how to implement near real-time analytics for e-commerce data using Bauplan, Prefect, and Streamlit. The project demonstrates near real-time processing, SQL/Python transformations, branch-based development, and live metric visualization.
Overview
Efficiently processing and analyzing data in near real-time is crucial for deriving actionable insights and driving business decisions. Applications often generate a continuous stream of product and user behavior data that needs to be ingested, processed, and visualized with minimal delay.
Consider an e-commerce website where we want to create dashboards capturing behavioral patterns and key business metrics, such as total revenue per day, total unique users per day, trends over time (e.g., revenue growth, user engagement metrics) and so on.
To achieve this, we need to:
Ingest data streams from the application.
Process the data in micro-batches or near real-time.
Visualize metrics using a BI tool or a dashboarding framework like Streamlit.
Schedule and orchestrate the entire process.
In addition, we ideally want to implement a robust workflow that should run quality checks on incoming data before feeding it into the pipeline, because data can be corrupted or contain anomalies due to faulty application behavior.
This can be easily attained using Bauplan built-in data branching which is used in this example to implement a Write-Audit-Publish (WAP) workflow with just a few lines of code.
In this example, we show how to:
Create analytics tables in bauplan using the “public.ecommerce” dataset (from Kaggle’s E-commerce Behavior Data).
Simulate streaming data by appending rows to core tables and rebuilding downstream tables using Prefect for orchestration.
Implement data branching strategies to isolate ingestion from pipeline artifacts (WAP).
Visualize live results through a Streamlit dashboard reflecting the latest data from the main branch.

Prerequisites
bauplan API key
👉👉👉 To use Bauplan, you need an API key for our sandbox environment: you can request one here. To get familiar with the API, start with our tutorial.
AWS Setup
To simulate a continuous stream of incoming data, we use an S3 bucket. You’ll need AWS credentials with permissions to:
Create and manage S3 buckets.
Upload files.
List bucket contents.
Quick Start
Open three tabs in your terminal.
Terminal 1: Set up your virtual environment
Create and activate virtual environment
python -m venv venv
source venv/bin/activate
pip install -r requirements.txt
Terminal 2: Start a Prefect Server
prefect server start
Keep this terminal running. This process hosts the Prefect server that manages the scheduled tasks and will be used to orchestrate the ingestion and the WAP worflow.
Terminal 1: Setup Prefect and run the pipeline
Configure Prefect (required before the first run)
prefect config set PREFECT_API_URL=http://127.0.0.1:4200/api
Set up AWS credentials in one of the following two ways:
Environment variables:
export AWS_ACCESS_KEY_ID=your_key
export AWS_SECRET_ACCESS_KEY=your_secret
export AWS_DEFAULT_REGION=your-region  # e.g., us-east-1
AWS config file (recommended):
Follow the AWS CLI configuration guide.
After setting up AWS credentials, run:
cd orchestrator
python run.py --username your_bauplan_username \
              --namespace your_namespace \
              --dev_branch your_branch \
              --bucket_name your_bucket_name
Terminal 3: Streamlit Dashboard
cd dashboard
streamlit run app.py
Keep this terminal running to maintain the Streamlit server up and use the Dashboard.

Project Structure
.
├── orchestrator/
│   ├── run.py        # Main pipeline script
│   └── utils.py      # One-off setup operations
├── pipeline_analytics/
│   ├── models.py     # Core metrics computation
│   └── *.sql        # SQL transformations
└── dashboard/
    └── app.py        # Streamlit visualization
What Happens When You Run the Script
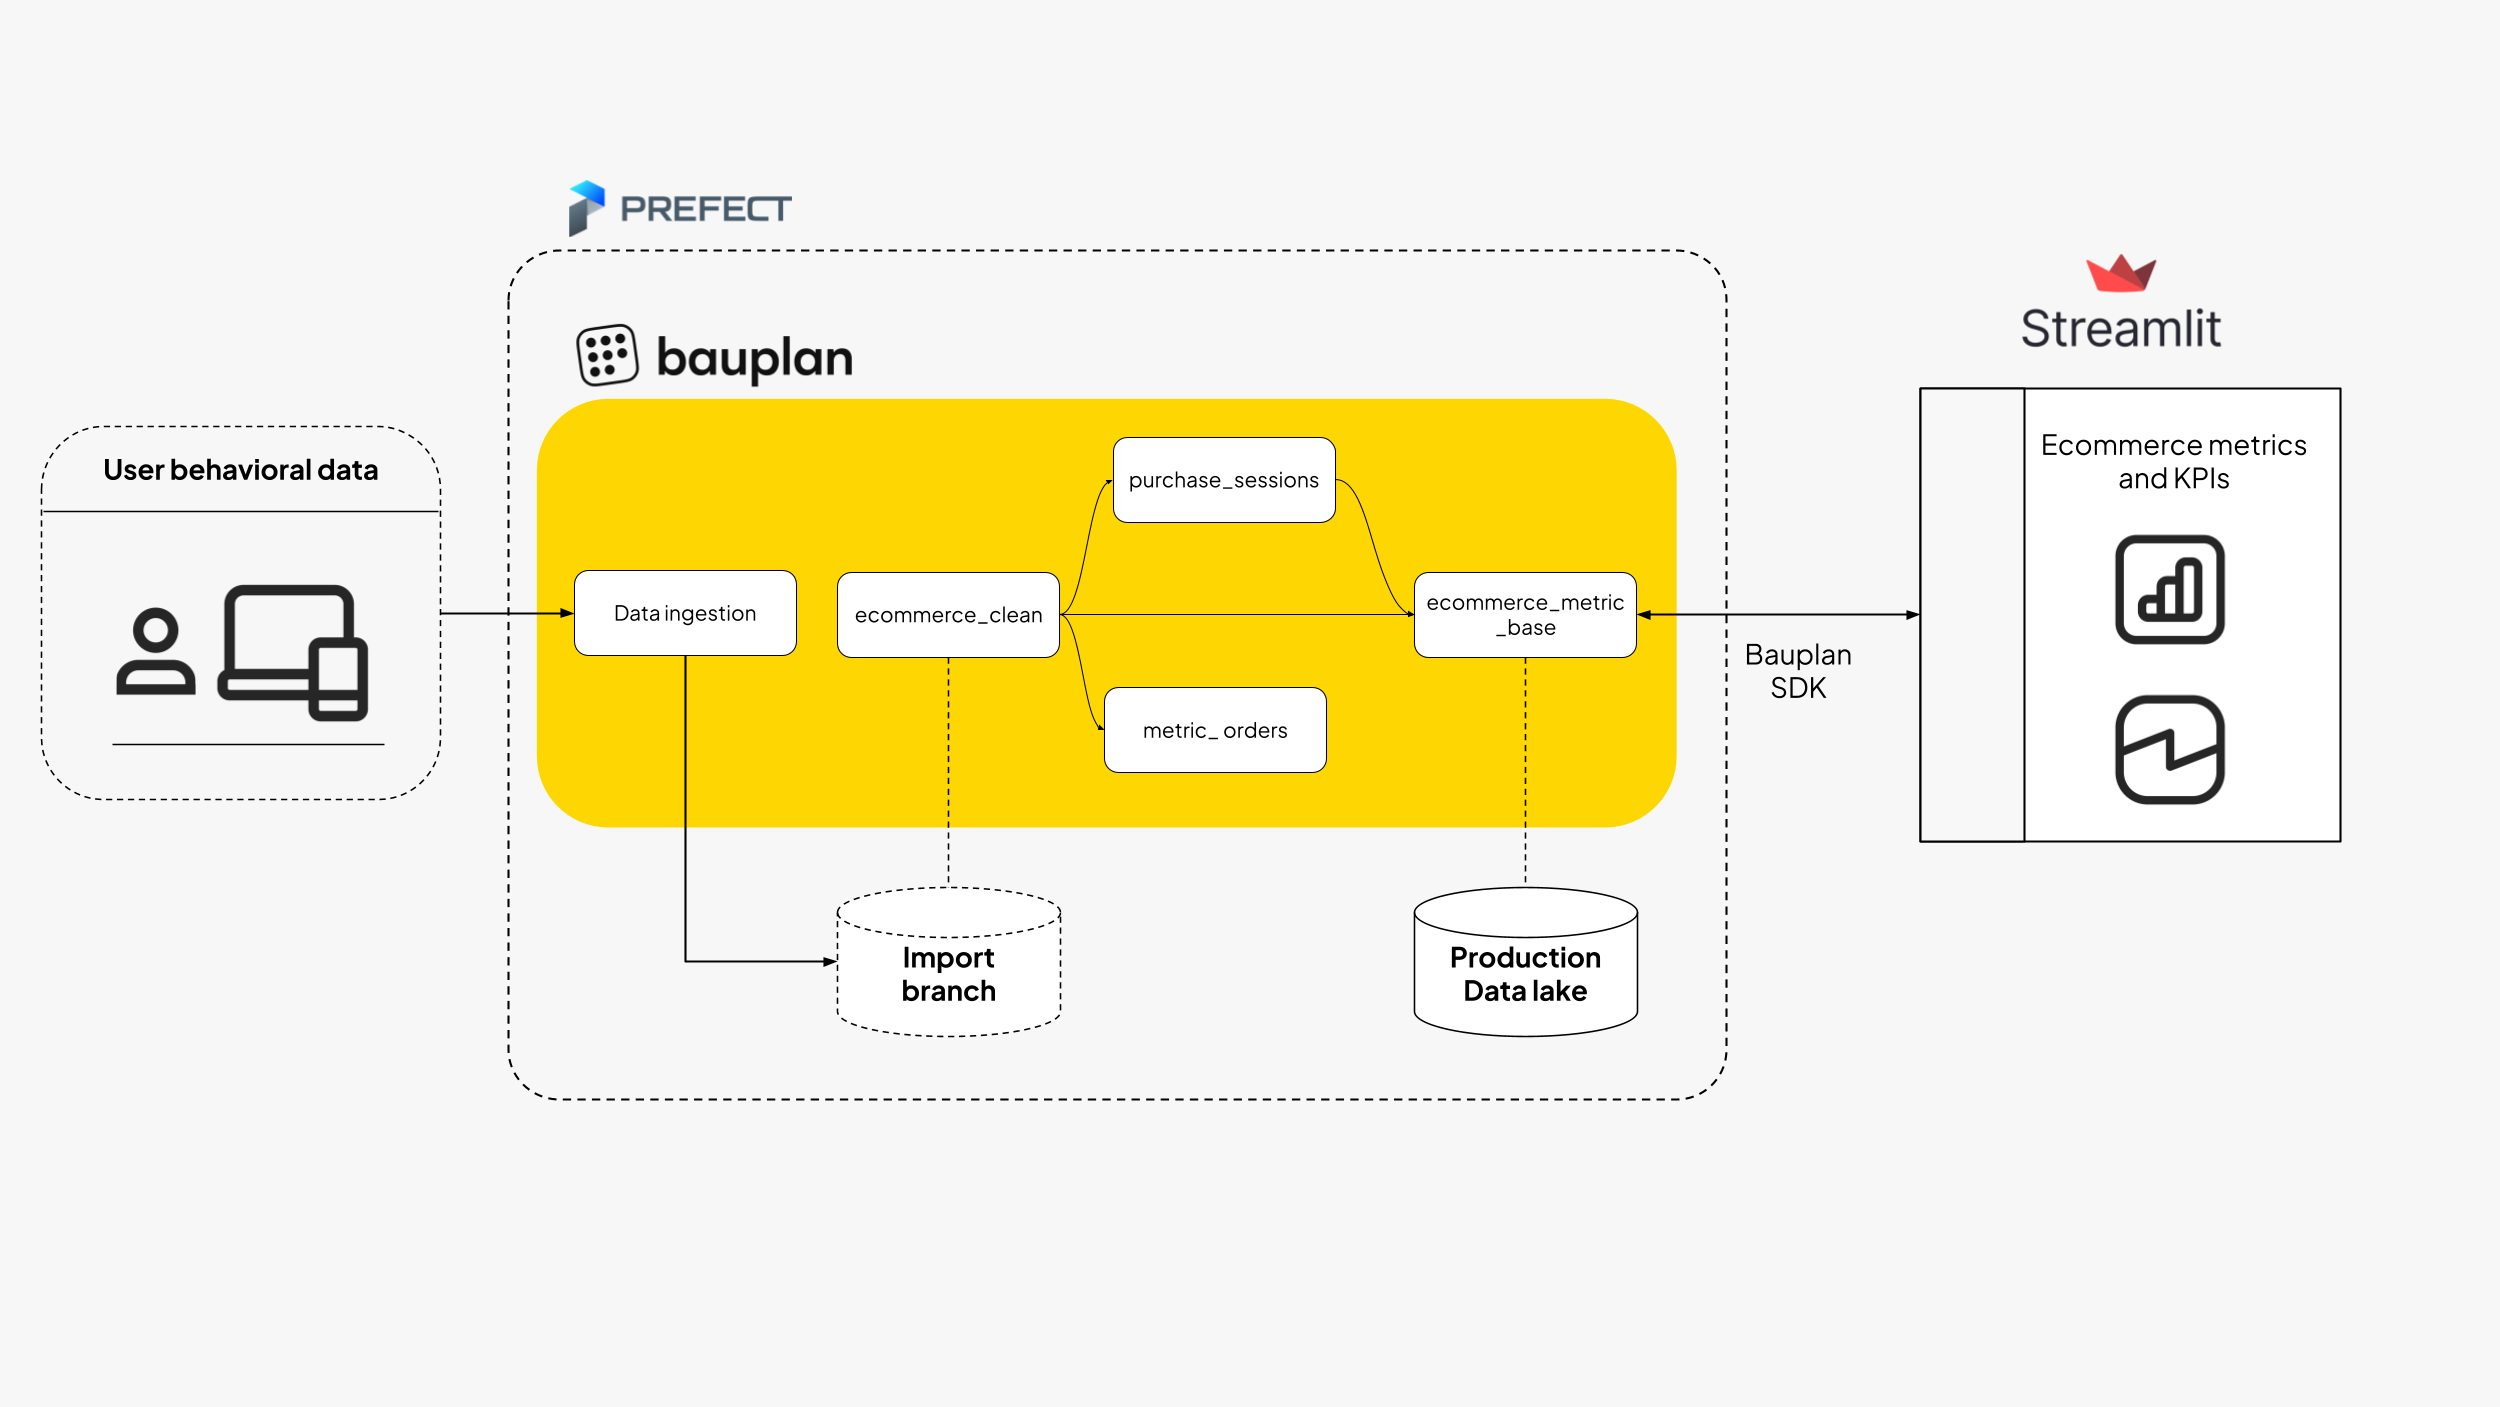
When you run the script in the folder orchestrator, you trigger a Prefect flow which is executed on a local Prefect server. The flow contains some one-off setup operations that will be executed upon the first execution and then run our transformation pipeline on a schedule every 5 minutes.
This is meant to simulate the streaming of data coming form our e-commerce application and the consequent quasi real-time processing to keep the dashboard fresh.
First Run: ONE-OFF Setup (utils.py)
Creates development branch from main
Builds initial cleaned dataset
Sets up S3 bucket for simulated events
Every 5 Minutes: Scheduled Operations (run.py)
Simulates new e-commerce events.
Ingests data using temporary branches to implement a WAP workflow.
Run the analytics pipeline to updates the tables visualized in the Streamlit app.
Analytics pipeline (pipeline_analytics folder)
In the pipeline_analytics folder, the file models.py contains three bauplan functions that constitute our transformation pipelines to generate the final table to visualize.
The pipeline creates a full funnel of metrics from browsing (views) to purchasing (revenue), enabling analysis of:
User engagement (sessions)
Conversion (purchases)
Revenue performance
Brand-level trends
Hourly patterns
The analytics pipeline looks like this:
Streamlit app and visualization
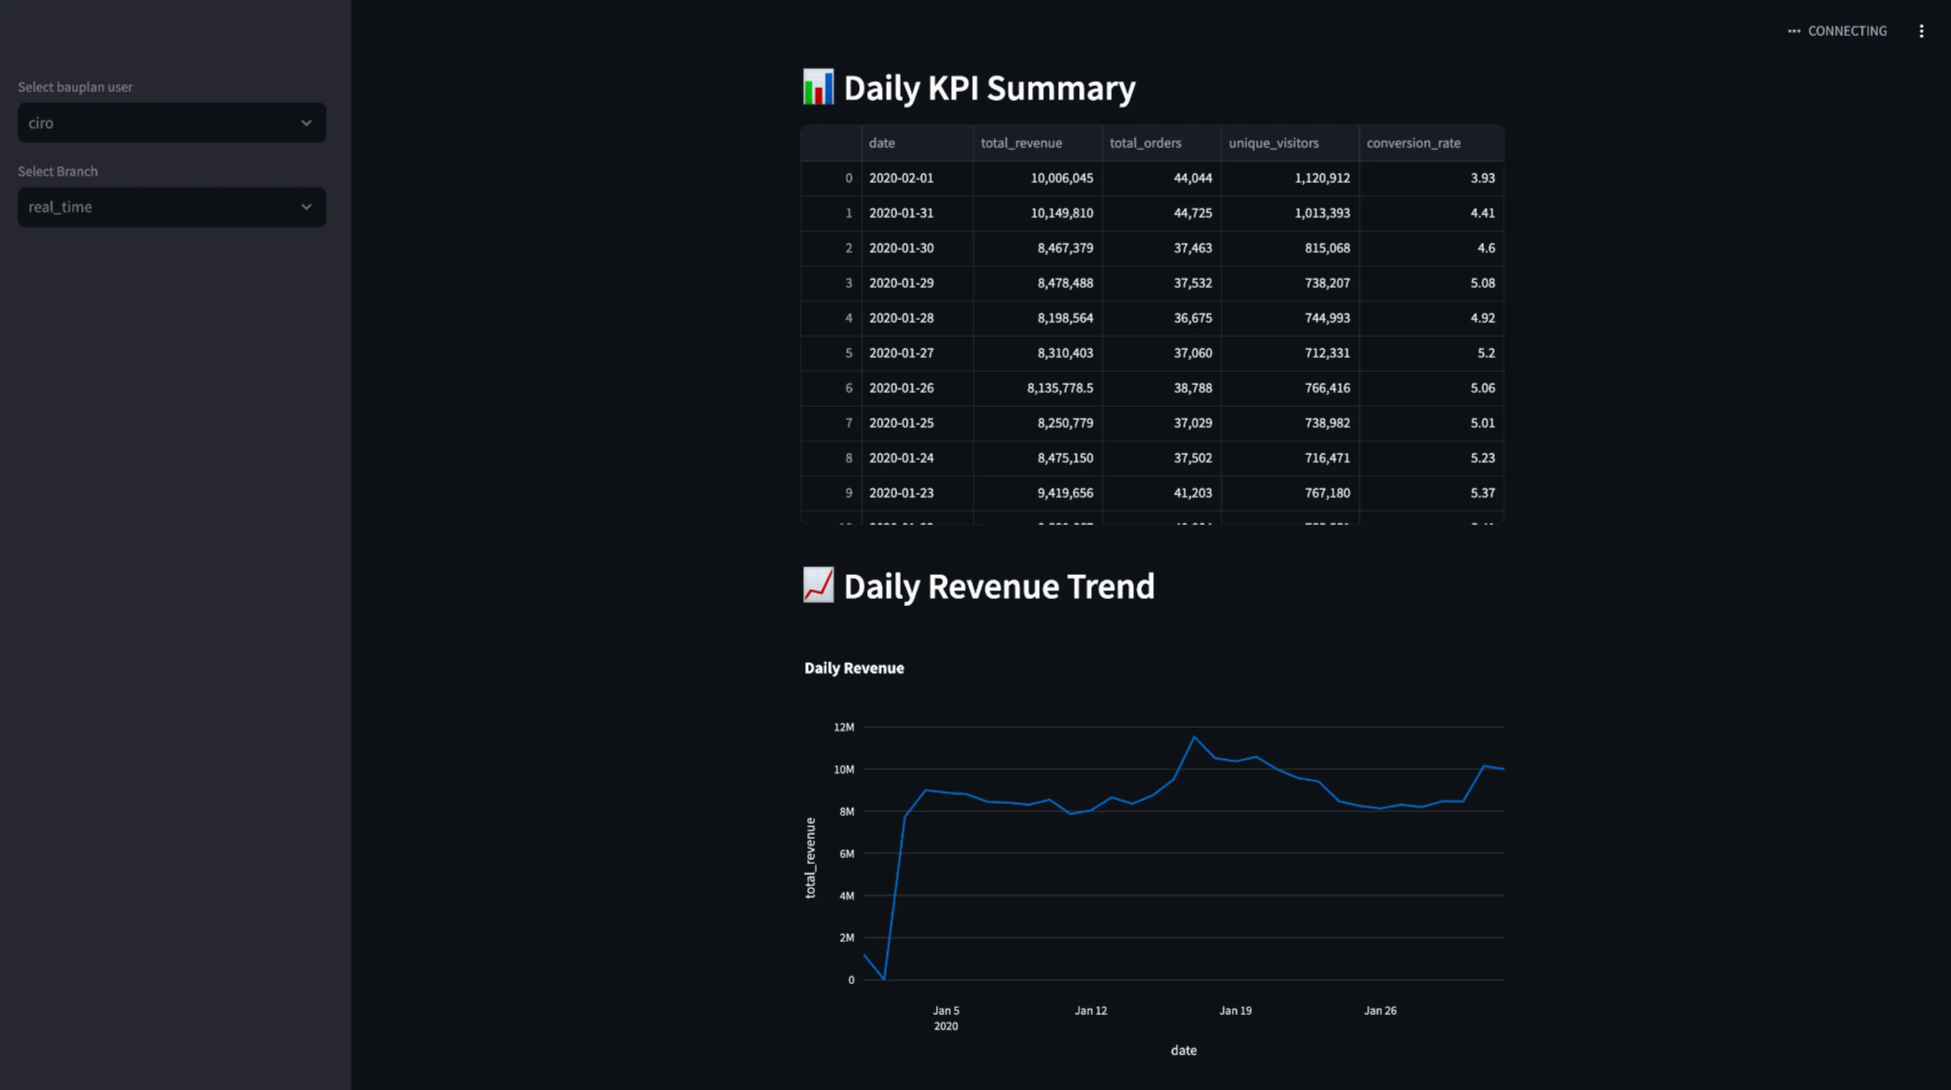
The project includes a simple Streamlit dashboard in dashboard/app.py to visualize the final aggregated metrics from our analytics pipeline. The dashboard provides an easy way to pick a branch and monitor the calculated metrics with minimal setup.
Usage
The visualization app is pretty straightforward:
Select your Bauplan username from the dropdown.
Choose the branch created by the analytics pipeline.
View your metrics instantly and keep track of the changes every 5 minutes.
For more advanced Streamlit features and customization options, check out the Streamlit documentation.
View the Streamlit dashboard at http://localhost:8501
Monitoring
Prefect provides a intuitive UI to monitor the whole workflow and pipeline runs. Check Prefect UI at http://localhost:4200
Conclusion
This near real-time monitoring app is a simple yet powerful showcase of how simple it is to build an end-to-end data application with Bauplan.
From managing raw data streams to quarantining bad data, transforming it into useful insights, and presenting it visually, this implementation juggles multiple data structures and frameworks seamlessly. Thanks to Bauplan, the heavy lifting of infrastructure management is completely out of sight, leaving you free to focus on what matters most: delivering insights.
You never worry about servers, containers, data copies and table versions. The whole business logic stays in two Python scripts that you can run in the cloud from anywhere, one for the analytics pipeline and one for the orchestration workflow.
Moreover, it is extremely easy to program workflows with other tools, using Bauplan Python client to integrate with Streamlit for data visualization and with Prefect for scheduling and orchestration.